Working paper · Empirical asset pricing
Revisiting the IVOL Puzzle in China
Evidence from deep learning models
Does the negative relation between idiosyncratic volatility and future returns survive a better volatility forecast? We compare 22 forecasting models and examine how measurement choices change the asset-pricing conclusion.
Using Chinese A-share data from January 2000 to March 2025, we combine out-of-sample IVAR forecasts with portfolio sorts, risk adjustment, and Fama–MacBeth regressions. The analysis also separates overnight and intraday returns and tests how extreme forecast errors influence the estimated relation.
Forecast quality matters
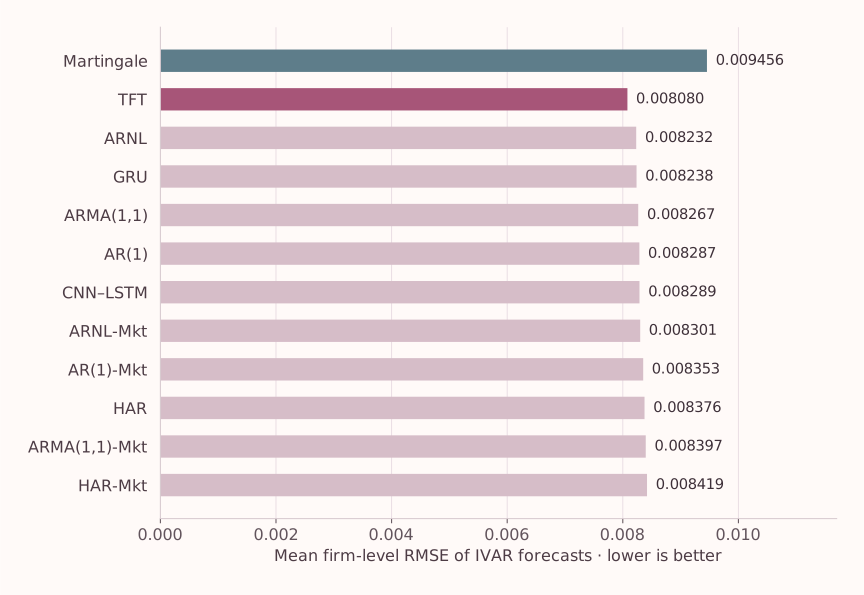
TFT reduces mean firm-level RMSE from 0.009456 to 0.008080, approximately 14.5% relative to the Martingale benchmark. Several conventional time-series models also perform well. The chart shows the 12 baseline specifications; the broader study evaluates 22 models including extensions.
View forecast values
| Model | Mean firm-level RMSE |
|---|---|
| Martingale | 0.009456 |
| TFT | 0.00808 |
| ARNL | 0.008232 |
| GRU | 0.008238 |
| ARMA(1,1) | 0.008267 |
| AR(1) | 0.008287 |
| CNN–LSTM | 0.008289 |
| ARNL-Mkt | 0.008301 |
| AR(1)-Mkt | 0.008353 |
| HAR | 0.008376 |
| ARMA(1,1)-Mkt | 0.008397 |
| HAR-Mkt | 0.008419 |
A small error tail changes the inference
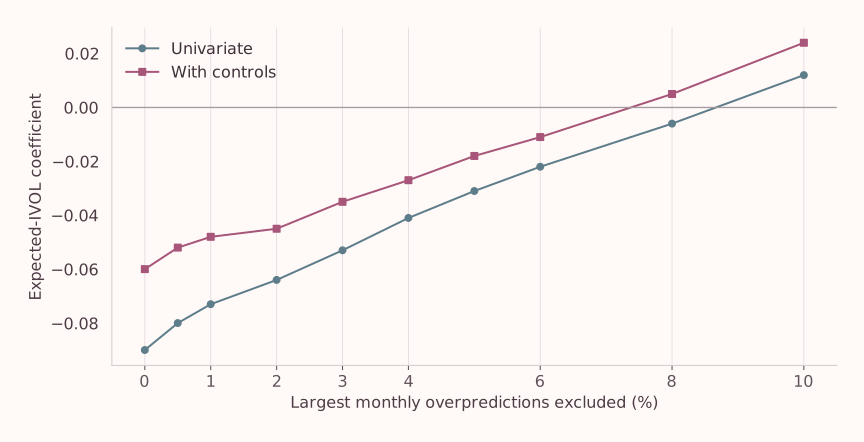
The negative Martingale-based IVOL coefficient is sensitive to severe overpredictions. After excluding the largest 3% of monthly overpredictions, the controlled coefficient changes from −0.060 (t = −2.695) to −0.035 (t = −1.480), losing conventional statistical significance.
View coefficients and t-statistics
| Excluded (%) | Univariate β | t-stat | Controlled β | t-stat |
|---|---|---|---|---|
| 0 | -0.09 | -2.611 | -0.06 | -2.695 |
| 0.5 | -0.08 | -2.29 | -0.052 | -2.325 |
| 1 | -0.073 | -2.095 | -0.048 | -2.139 |
| 2 | -0.064 | -1.797 | -0.045 | -1.956 |
| 3 | -0.053 | -1.436 | -0.035 | -1.48 |
| 4 | -0.041 | -1.119 | -0.027 | -1.13 |
| 5 | -0.031 | -0.829 | -0.018 | -0.743 |
| 6 | -0.022 | -0.592 | -0.011 | -0.461 |
| 8 | -0.006 | -0.146 | 0.005 | 0.186 |
| 10 | 0.012 | 0.298 | 0.024 | 0.885 |
Newey–West standard errors with 12 lags. This is an ex-post diagnostic using realized forecast errors, not an implementable trading filter.
What remains after risk adjustment?
IVOL long–short portfolio alphas are statistically insignificant across forecasting models after Chinese four-factor (CH-4) adjustment. Decomposing returns reveals a more stable negative overnight relation and a positive intraday relation that is sensitive to controls and forecast errors. These opposing components help explain why the total-return result varies across forecasting methods.
Forecast design & interpretation
The baseline sample excludes the smallest 30% of stocks by monthly floating market capitalization, listings younger than six months, and stocks with insufficient trading history. Forecasting requires at least 36 months of firm observations.
Models use expanding historical windows initially, then the latest 120 months. Deep-learning inputs consist only of the firm’s preceding 18 monthly IVAR observations. Training and validation are chronological; test observations are excluded from estimation, early stopping, and ensemble weighting.
Portfolio sorts and cross-sectional regressions test pricing implications separately from forecasting accuracy. More accurate forecasts alone do not imply a profitable strategy. Error-tail exclusions use future realized variance and therefore explain statistical sensitivity ex post. The overnight/intraday evidence is consistent with investor heterogeneity but does not directly identify investor groups or establish a causal mechanism.
Download forecast results (CSV) · Download exclusion results (CSV)
Source: Wu, Zhang, Zhao and Zhu, August 2026 working paper, §§2–6, Tables 1 and 9. Displayed figures reproduce reported summary values.